
Richard Feynman was one of the greatest physicists of the last century. His work spanned many disciplines and his curiosity drove him to explore and understand a variety of problems in the universe. He was awarded the Nobel Prize in physics in 1965.
Feynman, when facing a new problem, used a very simple approach to solve it. He first asked questions and inquired about the details. After that, he retired to think about it, and when he came back, he usually had the solution.
His ability to find the core of a problem and describe it in a simple, yet precise way, was unmatched. The method is summarized (probably by his friend and fellow physicist Murray Gell-Mann) as “The Feynman Problem Solving Algorithm”:
- Write down the problem.
- Think very hard.
- Write down the solution.
Intended as a joke, this sounds like a ridiculously simplified workflow for problem solving. One can hardly think that it can serve as an instruction for how to solve a problem.
But it can. In fact, it is even a very useful approach.
It can successfully be used when you build Qlik applications. When building QlikView apps, you often encounter different problems: In figuring out which data to load, in modeling this data and in figuring out how to write different complex formulae.
Using the algorithm, you will find that the hardest part is the first point – to write down the problem. Or rather – to understand the problem in the first place. Point two and three often come automatically if you’ve done the first point properly. Just formulating the problem in precise words will help you understand the problem. And understanding the problem is the core of all problem solving.
The exercise of formulating the problem in words and explaining it to your users or to your peers will force you to start thinking, which means that you start working on point two. You may even write the first Qlik scripts to test different concepts, which means that you start working on point three.
This only shows that the three points are interconnected and that you will need an iterative approach to get it right. I often start working on all three points in parallel, but all the time I am aware that I need to understand the problem and think hard before I can deliver the final solution.
Some methods that I find useful:
- Listen to your users. They are the best source when it comes to understanding what the application should do; what the goals are. Which measures? Which dimensions? Discuss with them. Ask them questions.
- In data modeling, you should always ask yourself what each table or record represents. A table is a list of something – but what? Which field, or combination of fields, uniquely defines a record? Study the data. Understand the data.
- Visualize your data model. Draw it on a piece of paper, if needed. Name the tables so that you understand what each record represents. Don’t load a table unless you understand what its content is and how it relates to existing tables.
- Start small: Just one or two KPI:s and few dimensions. Make sure you understand the data model and its calculations before you expand it.
- A smoker, stuck with a problem, usually takes a break. He stops working and takes a cigarette instead. He starts thinking. Taking a break in order to think, is a very good habit that also non-smokers should adopt. So, once in a while you should walk away from the computer just to think.
Simplicity. Feynman was a genius.
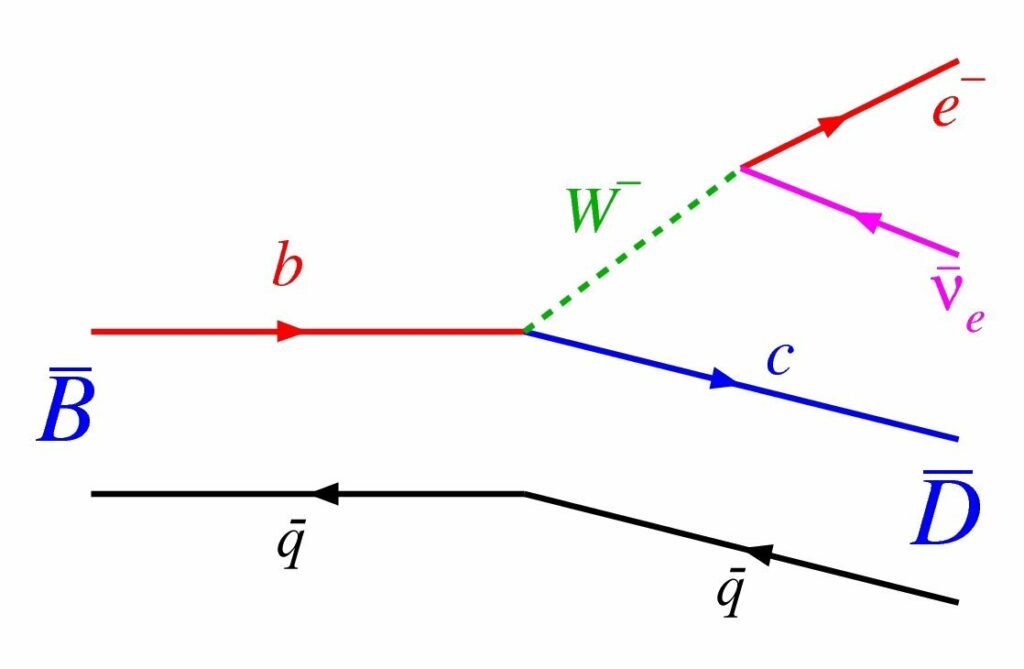
Above: The decay of a B meson depicted in a Feynman diagram.
Originally posted in the Qlik Business Discovery Blog on July 16, 2013. Photo by the Nobel Foundation.