Hierarchies are very common in database and business intelligence solutions. Usually, they are balanced and with a fix number of levels, and then they do not pose any problems. Just load the data, add a drill-down group, and you’re done.
But there is one type of hierarchy that is somewhat tricky to get right – an unbalanced, n-level hierarchy. Typical for this type of hierarchy is that the levels are not named – all nodes are stored in the same field – and you really don’t know on which level you need to search for a specific node.
The Adjacent nodes table – a compact storage method
Usually such a hierarchy is stored in an Adjacent nodes table, i.e., a table that has one record per node and each node has a reference to its parent. The table below shows an unbalanced hierarchy with some wine districts. Each district constitutes a node, and they are all stored with a reference to their respective parent district.
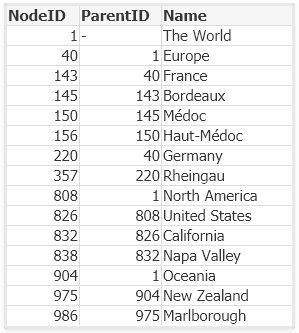
The Adjacent nodes table is easy to maintain and modify, so it is often the chosen method for storing a hierarchy.
The Expanded nodes table – for the analysis
The Adjacent Nodes table is however not suitable for analysis. It is possible to select a node, but you still wouldn’t know anything about the sub-nodes, since the link to them isn’t obvious.
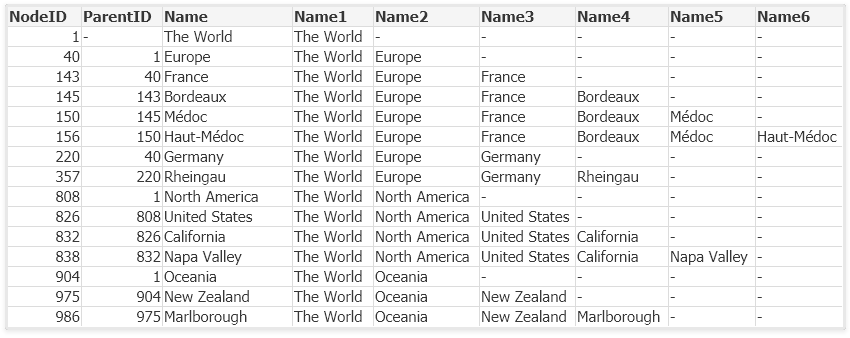
But if the table is loaded into the app using the Hierarchy prefix, you will get a useful table – the Expanded nodes table:

This prefix will transform the Adjacent Nodes table into an Expanded Nodes table that has additional fields that you can use in your app:
In the data model below, the table “Nodes” is loaded with this prefix.
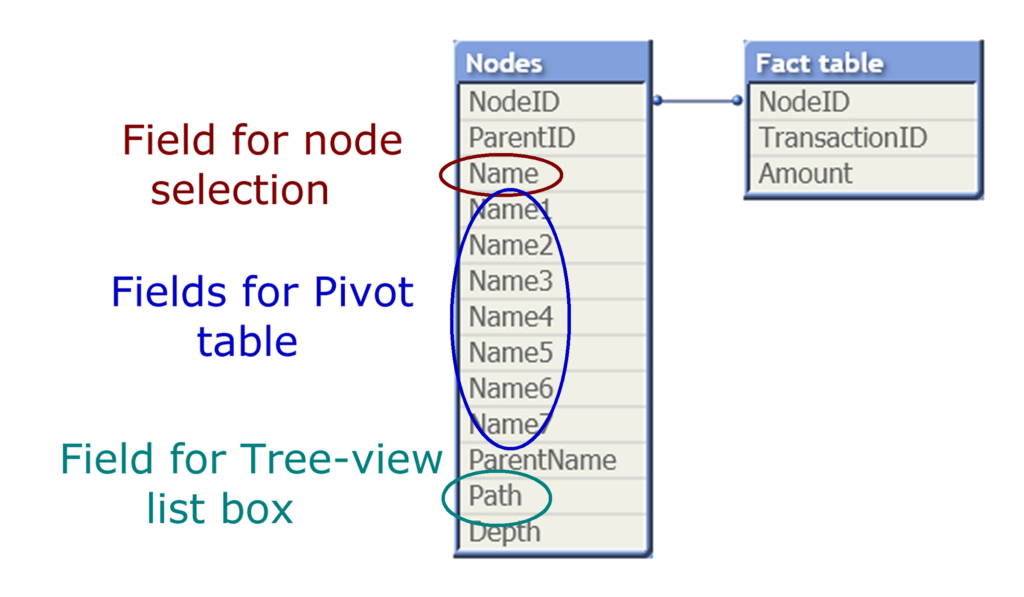
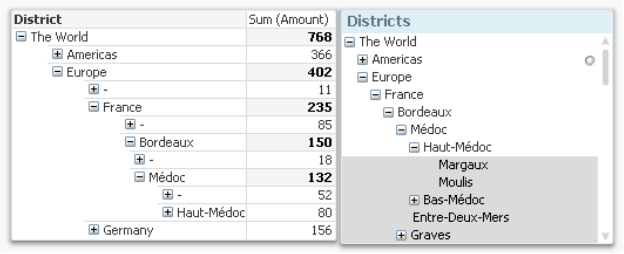
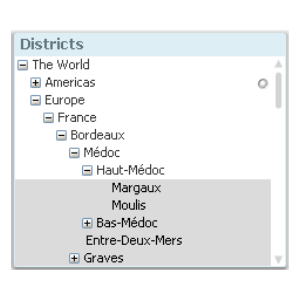
With the columns listing the different node levels (Name1…Name7), you will be able to create a pivot table showing the proper aggregations from the fact table. Further, the Path field can be used in a QlikView tree-view list box. Below you can see some wine districts displayed in both these object types:
The Ancestor table
One challenge with hierarchies is that you can refer to a node in two different ways: Either to the node including the entire sub-tree, or to the node only, excluding all sub-nodes. In the example with the wine districts, the entire tree would mean any wine from Bordeaux (including all sub-nodes). The node would mean unspecified Bordeaux (unspecified bulk wine without any specified sub-district). In the pivot table above, the difference is obvious: All wine from Bordeaux sums up to 150 units, and the unspecified Bordeaux sums up to 18 units.
A user usually wants to make selections referring to the entire sub-tree, but the above solution does not have any field for this. To create such a field, you need to use the second hierarchy-resolving prefix – the HierarchyBelongsTo:

This prefix will also transform the adjacent nodes table. The result will be an Ancestor table (the “Trees” table in the picture below) containing one record per descendant-ancestor pair. In other words, the ancestor (“TreeID)”) will link to all its descendants (“NodeID”) as well as to itself and will thus link to entire sub-trees.
Further, the Ancestor table is also perfect for authorization purposes, e.g. as reducing field in Section Access. See more in this post about Security.
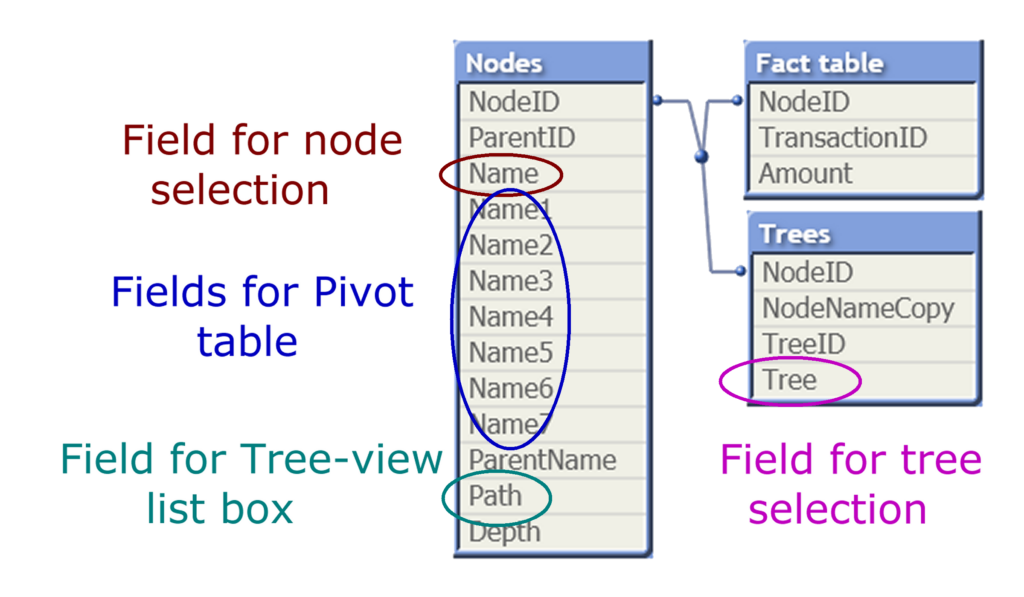
The name of the ancestor node is here called “Tree” so the user can understand the difference between a wine district as a node or as a tree. This field can be used for searches and selections of entire sub-trees.
The data model with the two hierarchy tables is the one I recommend: It generates all fields you need.
HIC
Originally posted in the Qlik Design Blog and in the Technical brief “Hierarchies” published on Nov 12, 2013
Hierarchy and HierarchyBelongsTo are indeed very powerful for handling different business cases. I’ve used HierarchyBelongsTo to identify bosses and their subordinates all the way down the chain, including high level managers with n-level organization below them. Combining this with plug-and-play/mix-and-match section access “packages” for each different use cases designed to be combined as needed in the final data model, with built-in flags for anonymizing individual dimensional fields by using a link table between fact/section access/dimension. Sometimes it’s a bit crazy the kind of functionality you can squeeze out of Qlik with the right customer and crazy requests.
Hi Henry,
Always a pleasure to read/reread your posts.
Using a lot of hierarchies since you trained me …
( approx 15 years ago.. I think it was summer of 2008, in Bucharest … :-O )
1. I ‘ve reached some time ago to some limits of the Hierarchy that I think you have already addressed:
It’s about passing graphs that has less constraints than a hierarchy has. (For instance loops)
It would be great to have a chat on this matter , when you can.
2. An interesting situation where we used hierarchy (but went even further): we’ve created an algorithm that read a table that has contains specific parameters defined “by exceptions”.
For instance you need to define different MaximalDaysOfStock thresholds, but you have 200k SKU (or even 1mil+ SKU).
And some rules are by category, others by vendor, others by supplying warehouse, and there is always possible to have a rules, valid for a special case, based on another level of article or purchase classification…
Keeping this data set would be almost a nightmare for users. Instead there is defined a general value, valid for all the items, and then, coming down a hierarchy that defines the articles classifications importance, special definition can be defined as exceptions for the higher rules. This can create the premises so only a few records has to be maintained.
Our script takes this “swiss cheese like” definition and populates afterwards the proper parameter(s) to each article, regardless how may levels in the hierarchy and how many SKUs handled.
(It’s almost like a parametric equalizer used in Sound Mixers, for the audio geeks)
Sempre fi,
Cotiso
Coming back on matter 1… probably semantic links can help in some graph cases… but not sure the loops can be handled…
Any suggestions/thoughts ?
Sempre fi,
Cotiso